8 · Dashboards
Open Intelligence → Dashboards to build and view custom dashboards from a library of widgets.
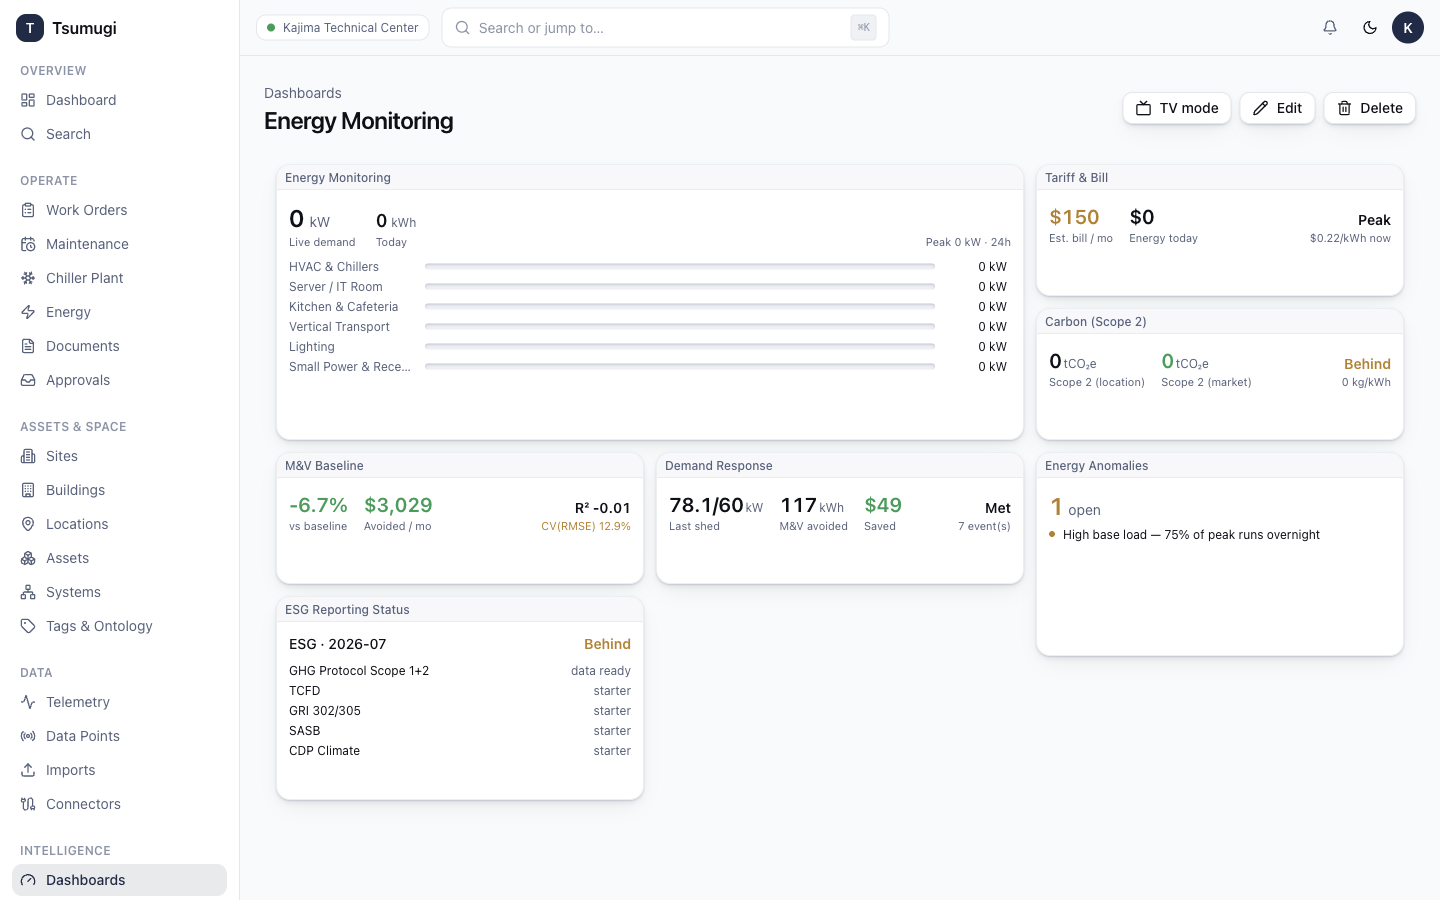
8.1 Create a dashboard
- Click New dashboard (or Create from template — e.g. Energy Monitoring, Chiller Plant, FM Ops, Executive).
- Give it a name. A template arrives pre-populated with relevant widgets.
8.2 Add & arrange widgets
- Click Edit.
- Open the Add widget panel and pick a widget. The catalogue is permission-filtered — you only see widgets your role can use. It includes KPIs, charts, tables, and the CPMS/EMS widgets (chiller performance, staging, forecast, faults; energy, tariff, carbon, M&V, demand-response, ESG).
- Drag a widget to move it, drag its corner to resize. Widgets snap to the grid.
- Some widgets have settings — click the gear on a widget to edit (e.g. bind a data point).
- Click Save. Layouts are versioned, so you can revert.
8.3 Share, embed & big-screen modes
- Share a dashboard with a link — recipients see it according to their grants.
- TV mode hides the chrome and auto-refreshes — ideal for a wall display.
- War-room shows several dashboards at once for an operations room.
Widgets are live and self-refresh. If a live tile reads 0, the underlying sensor may simply be quiet at that moment.